
A 1.3% reduction in 2025 continues a two-decade decline, with solar power overtaking hydropower for the first time.
Brussels, April 11, 2026 – The European Commission has today published verified EU Emissions Trading System (EU ETS) emissions data for 2025, showing a -1.3% reduction in covered emissions compared to 2024 levels. This marks another year of steady decline for the world’s largest carbon market.
The EU ETS has halved emissions in the sectors it covers since its launch in 2005. It remains firmly on track to achieve its 2030 target of a 62% reduction below 2005 levels.
Power Sector: Solar Surges as Renewables Hold Steady
Emissions from power generation through fossil fuel combustion continued their downward trajectory, falling by -0.4% in 2025, even as EU net electricity generation grew modestly by 1.7% year over year.
The share of renewable electricity in the total power generation mix saw a small uptick, reaching 47.3% compared to 47.2% in 2024. However, this headline figure masks a significant structural shift beneath the surface.
Solar Overtakes Hydropower
Solar power experienced extraordinary growth of 24.6% year-over-year in 2025—the biggest increase of any electricity source. This growth counteracted downturns in wind and hydroelectric production caused by lower wind speeds and reduced rainfall in Northern Europe.
Remarkably, these conditions combined with continued expansion of solar capacity—boosted solar generation to the point where it overtook hydropower for the first time, becoming the EU’s second-largest renewable electricity source after wind
A separate analysis by energy think tank Ember found that wind and solar together generated 30.1% of EU electricity in 2025 (841 TWh), surpassing all fossil power sources, which generated 29.0% (809 TWh). This marks the first time wind and solar have collectively outpaced fossil fuels in the EU’s power mix
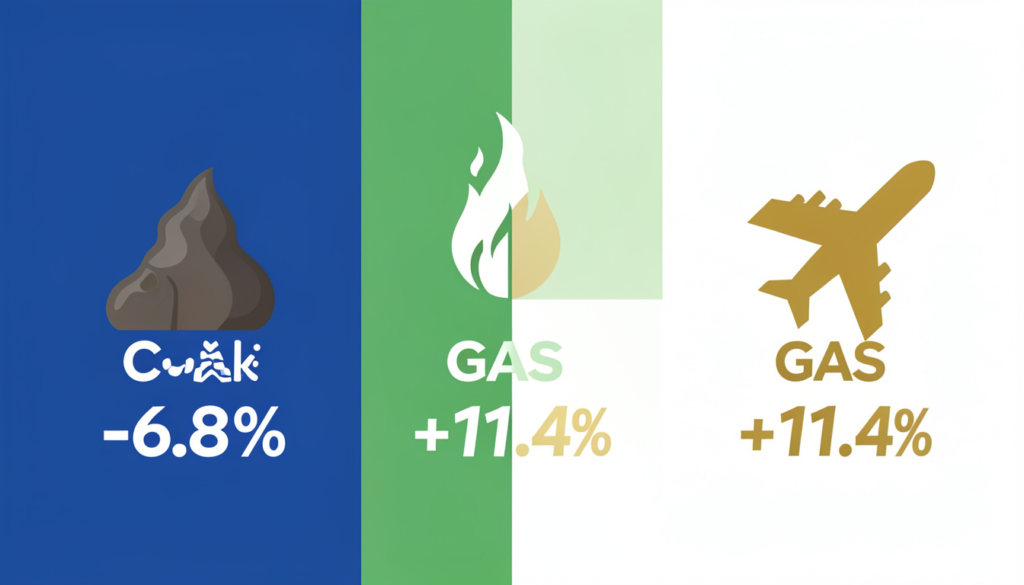
The Gas-Coal Divergence
While total electricity generation from fossil fuels increased by 3.5% year over year, this aggregate masks a critical divergence:
| Fossil Fuel | 2025 Change |
| Coal power emissions | -6.8% |
| Natural gas generation | +11.4% |
The data suggests a continued transition from coal to gas as a “bridge fuel,” even as overall fossil generation ticked upward due to lower renewable output from wind and hydro.
Industry: Emissions Decline 2.5%
Emissions from energy-intensive industries showed a downward trend of 2.5% , driven primarily by reductions in the cement sector as well as iron and steel production.
According to commission analysis, this reduction results partly from reduced activity in the construction sector and broader economic factors but also from the transformation of industries as part of the clean energy transition. Further analysis is ongoing, as trends vary significantly across industrial subsectors
Aviation and Maritime: Mixed Signals
Aviation Emissions Rise
—thoughFor aircraft operators, emissions covered by the EU ETS slightly increased compared to 2024 due to traffic increases. This follows a 2024 pattern where aviation emissions rose by approximately 15% above 2023 levels — though roughly half of that increase was attributable to an expanded geographical scope rather than pure volume growth .
The EU continues to phase down free allocation of emission allowances to aircraft operators while rewarding the use of sustainable aviation fuels (SAF) through additional allowance allocation. The EU also became the first jurisdiction to introduce monitoring and reporting of non-CO₂ aviation effects.
Maritime Emissions Fall
For the maritime sector included in the EU ETS for the first time in 2024 reported data so far shows emissions fell by around 3% . Compliance in the sector’s first year was high, with shipping companies surrendering allowances for more than 99% of their relevant requirements.
Context: 2024 Emissions and Revenue
The 2025 data builds on a strong foundation. In 2024, EU ETS emissions from power and industry installations fell by 5.8% compared to 2023, continuing the post-pandemic downward trend .
The system also raised €38.8 billion in auction revenue in 2024, distributed primarily to Member States to fund renewable energy projects, energy efficiency retrofits, public transport expansion, and industrial decarbonization. Total revenue raised by the EU ETS to date exceeds €250 billion.
Data Reporting Notes
The 2025 data was reported by EU member states as of the deadline of 31 March 2026 for stationary installations, maritime operators, and aircraft operators. The submitted data covers the vast majority of operators within the scope of the Directive.
Reporting for aviation and maritime emissions is ongoing, and final trends will only become clear once this process is complete. The European Commission notes that the data published today represents verified emissions, with final compliance data expected later in the compliance cycle.
Looking Ahead: 2030 Target in Sight
With emissions already halved since 2005 and a clear trajectory of annual reductions, the EU ETS remains one of the world’s most effective carbon pricing mechanisms. The system’s cap continues to tighten through a linear reduction factor of 4.4% per year , ensuring that the 62% reduction target for 2030 remains within reach .
As solar power accelerates, coal continues its decline, and industries transform their processes, the EU ETS is proving that carbon pricing, when designed effectively, can drive deep decarbonization without compromising economic growth.
References
- European Commission, Directorate-General for Climate Action (2026, April 10). EU Emissions Trading System sustains downward trend in covered emissions. https://climate.ec.europa.eu/news-other-reads/news/eu-emissions-trading-system-sustains-downward-trend-covered-emissions-2026-04-10_en
- European Commission, Directorate-General for Climate Action (2025, December 3). 2025 Carbon Market Report: EU ETS lowers power sector emissions and expands to maritime transport. https://climate.ec.europa.eu/news-other-reads/news/2025-carbon-market-report-eu-ets-lowers-power-sector-emissions-and-expands-maritime-transport-2025-12-03_en
- European Commission (2025, November 6). EU Climate Action Progress Report 2025 (COM(2025) 668 final). EUR-Lex. https://eur-lex.europa.eu/legal-content/EN/ALL/?uri=COM%3A2025%3A668%3AFIN
- CCarbon (2026, January 23). European Union Gets More Power From Wind and Solar Than Fossil Fuels in 2025. https://www.ccarbon.info/news/european-union-gets-more-power-from-wind-and-solar-than-fossil-fuels-in-2025/
- European Hydrogen Observatory (2025, December 1). EU emissions trading system (EU ETS). https://observatory.clean-hydrogen.europa.eu/eu-policy/eu-emissions-trading-system-eu-ets